Smart Factory and the future of energy
The manufacturing industry accounts for much of the world’s energy consumption. In 2021, manufacturing accounted for a whopping 33% of all energy consumption in the U.S. Energy Information and Administration. In Norway, industry uses almost twice as much energy as private individuals annually*. By taking steps to reduce energy consumption, manufacturing companies can make a major impact on total consumption in the world.
* Based on calculation with average figures (2022) from Statistics Norway.
Many manufacturing companies have already adopted sustainability strategies to reduce consumption and emissions, and more and more are trying to get started. With the ongoing energy crisis and rising energy costs, many manufacturing companies are dependent on reducing their energy consumption to remain competitive – or even survive. In addition, the industry faces stricter regulations and regulatory requirements related to sustainability, as well as more environmentally conscious consumers. The time to start producing more sustainably is now.
Use digital tools to implement sustainability strategies on the site floor
Although many manufacturing companies already have sustainability strategies in place, the practical challenge is implementing the strategy on the plant floor. In order to produce more sustainably, it is crucial that production personnel have access to information on a daily basis. Only with insight into energy and raw material consumption can measures be taken to optimise production.
To solve this, you should use digital tools, which give operators and other personnel the information they need, while constantly working on the production process. Access to both real-time and historical data makes it possible to make both immediate and long-term improvements in production related to energy and raw material consumption, faulty manufacturing, traceability and more.
3 steps to reduce energy consumption
How can digital tools be used in practice? Below we share 3 steps on how you can map and optimize energy consumption in the production process.
Step 1: Map – “Are we using too much energy?”
See your spend compared to your normal spending, goals or budgeted spend in real time.
- Monitor consumption related to process areas and production lines
- Record events in production
- Record shifts, time of day and weather conditions
- Compare performance across plants, products, and manufacturing teams
- See consumption compared to sustainability KPIs (e.g. production carbon emissions)
Step 2: Explain – “Why are we using extra energy?”
Leverage context from the site floor to understand how to improve resource efficiency.
- Map the resource consumption of all products
- Find inefficient equipment
- Discover unknown patterns, wrecks or opportunities for improvement
- Contextualize data to manage sustainability KPIs
- Use best practice to standardize operations
Step 3: Optimize – “How can we reduce energy consumption and costs?”
Take actions that improve operational performance and sustainability, both at the process level and throughout the plant.
- Optimize production planning for better utilization of resources
- Reduce resource consumption and associated costs
- Reduce variations in production processes
- Make your supply chain more agile and resilient
- Ensure holistic optimization of the entire production environment
Sustainable production with Proficy Smart Factory
GE Digital’s Proficy Smart Factory software comes with all the features you need to gain insight into the manufacturing process and take action for a more sustainable production. Already using a MES solution from GE Digital? Then you have all the tools you need at your fingertips!
Via the Web-based dashboard platform Proficy Operations Hub, you can access visualized data anywhere, anytime. Below you can see tutorials of six widgets that can be used to gain insight into the energy and raw material consumption of the production process.
Proficy Operations Hub widgets
Sparkline
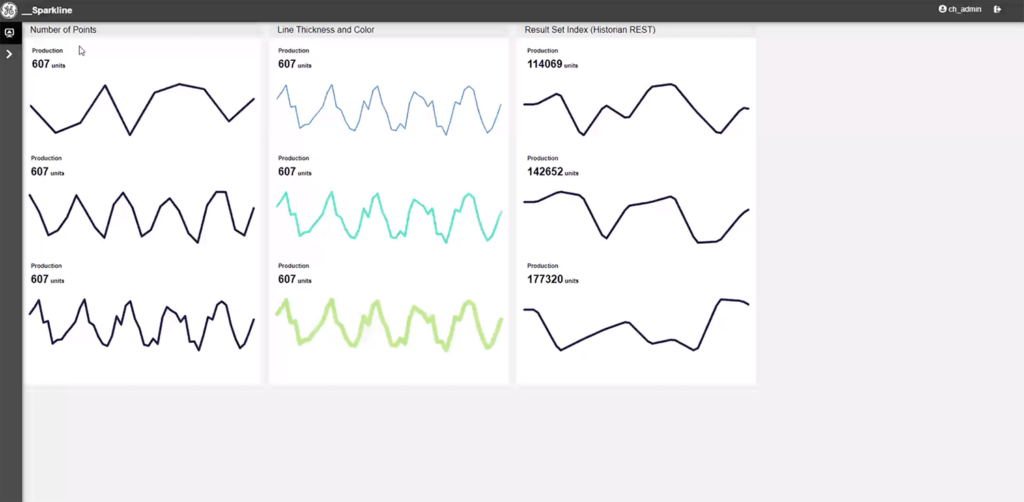
Displays time series data. Can be used in several areas:
- See energy or water consumption over a period of time
- Correlate energy or water consumption to temperatures/precipitation/weather conditions over a period of time
Bullet Graph
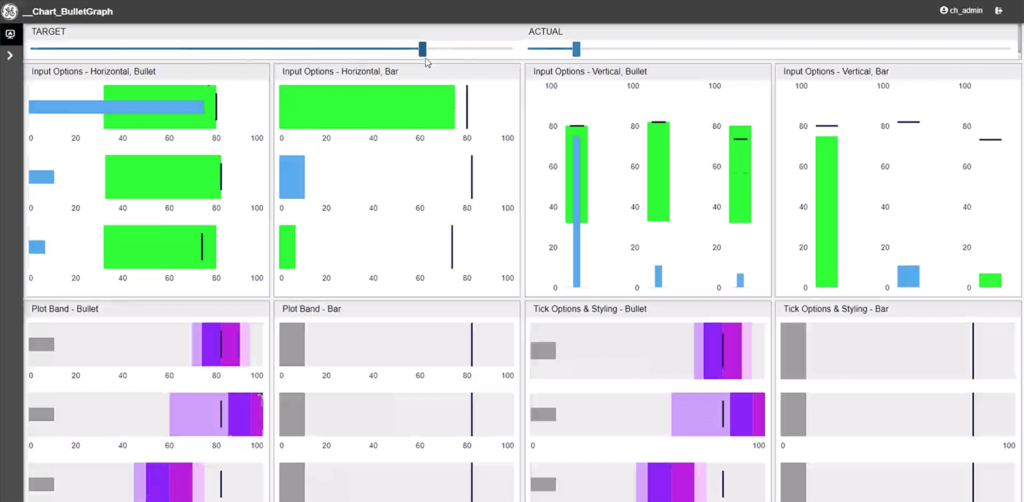
Displays target value and real value.
- See your energy consumption compared to normal consumption, budgeted consumption or goals
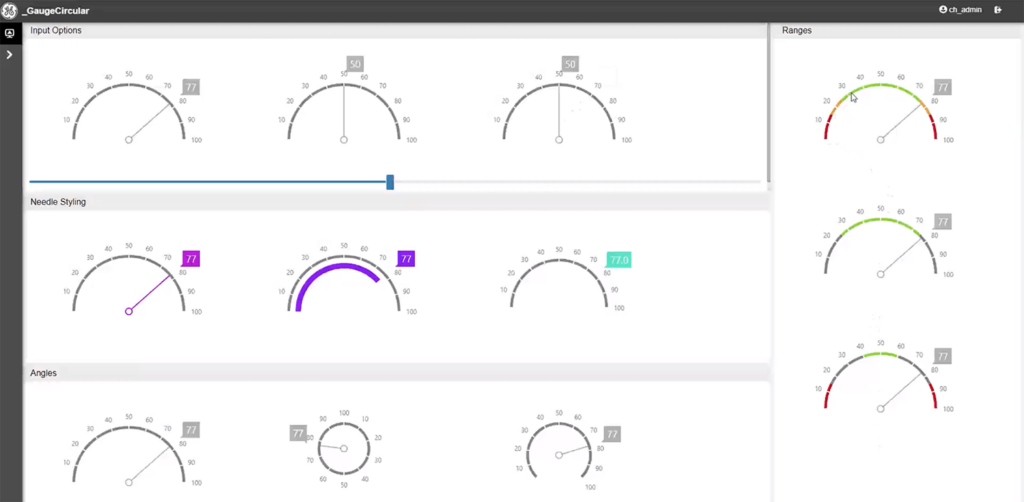
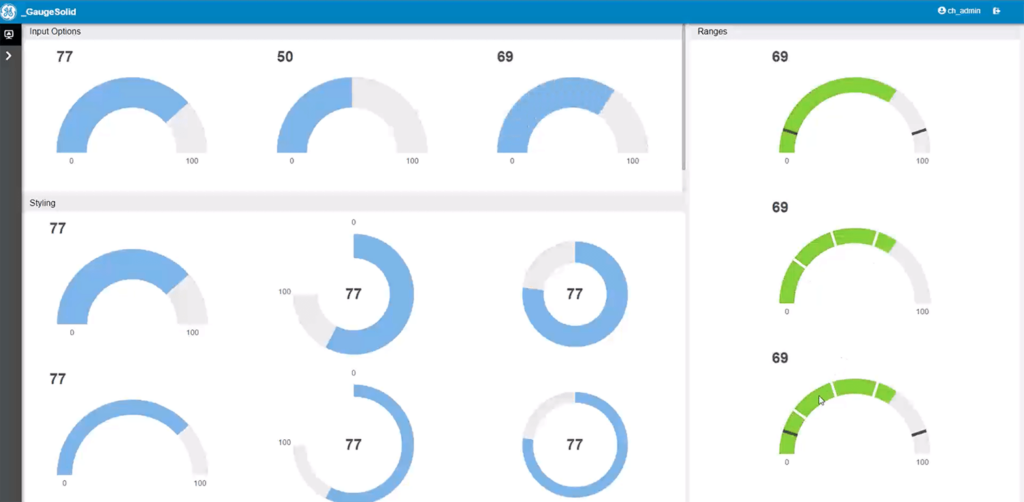
Bar Gauge, Circular Gauge and Solid Gauge
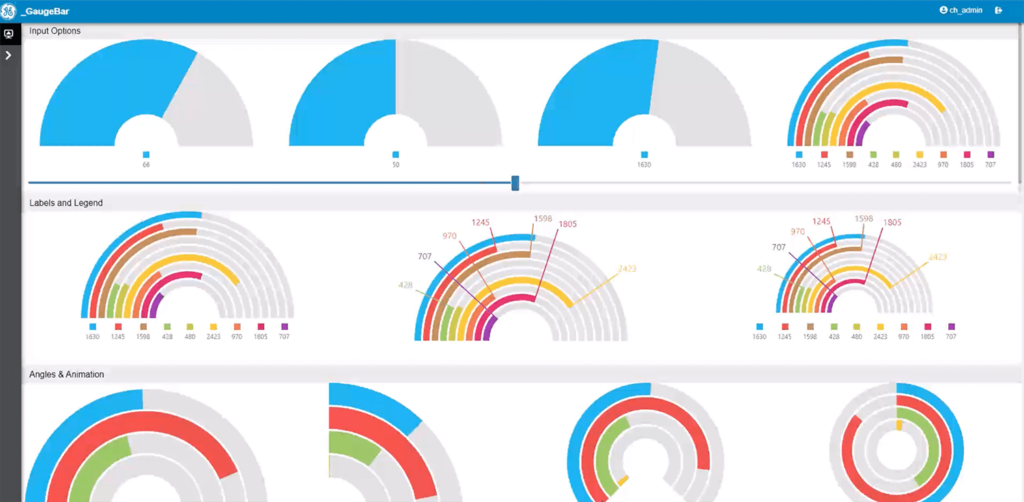
Three widgets with different visualization of value compared to bucket.
- See your energy consumption compared to normal consumption, budgeted consumption or goals
Pie Chart
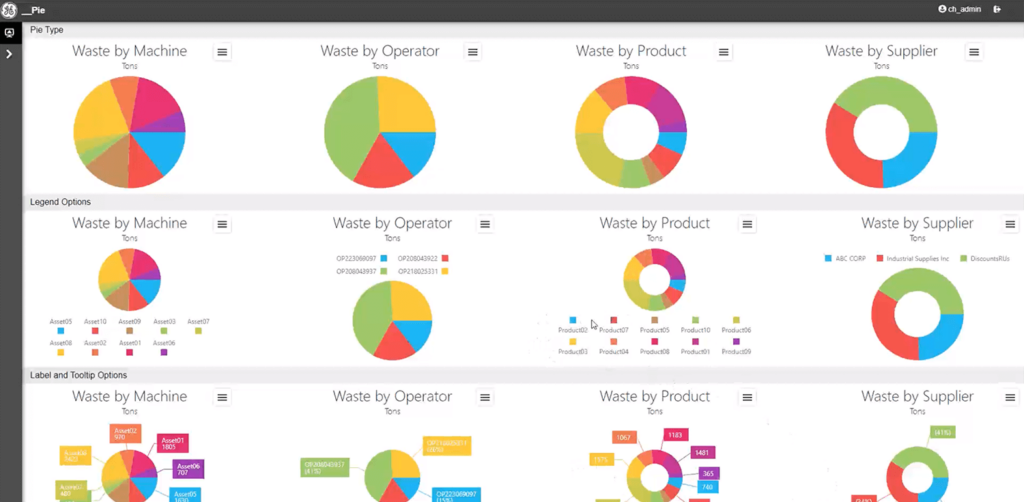
Displays data values in pie or doughnut chart. Can be used in several areas:
- Illustrate how consumption of e.g. energy and water affects total costs and greenhouse gas emissions
- Show most energy-intensive processes
- View material consumption
Join us in reversing the trend
According to Statista, it is expected that energy consumption in industry will continue to increase in the coming years. This is despite an increased focus on sustainability and several challenges for the manufacturing industry, including increased energy costs and stricter regulations and regulatory requirements.
With the right tools in place, you can make a difference – both for the environment and your own business. Do you want to help reverse the trend and work for a more sustainable industry? We’ll help you get started!